OpenUPM Trends Page Is Live
OpenUPM now has a public Trends page for tracking how the package catalog changes over time. The page brings the main ecosystem signals into one place, including package growth, active packages, release activity, signing and publishing modes, downloads, and topic momentum.
You can find it from the navbar under About > Trends, or from the About section in the homepage footer.
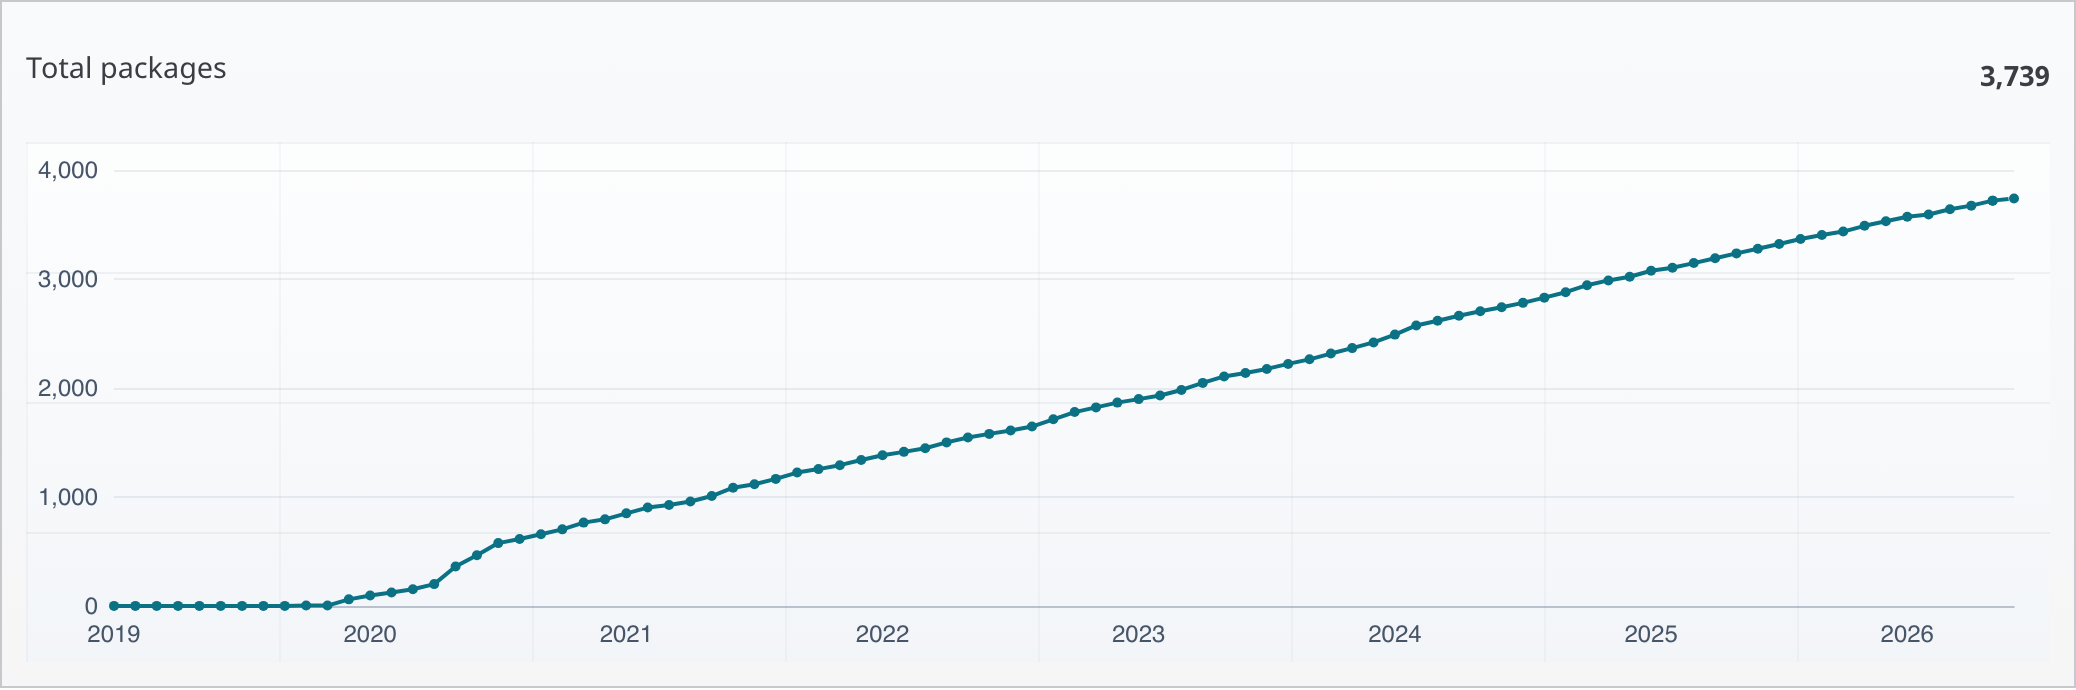
The first section focuses on catalog growth. It shows the total number of packages, the number of packages with a successful published release in the last 12 months, and monthly package additions. This makes it easier to separate the long-term catalog size from the packages that are still recently active.
Release And Publishing Signals
Release charts help show whether the ecosystem is actively shipping new package versions. The page includes total releases and releases per month, with the current incomplete month marked visually so it is not mistaken for a full-month drop.
OpenUPM also now separates signing and publishing-mode signals. Signing charts show how many packages have signing metadata on at least one release, while the publishing-mode chart shows whether packages are published from registry-built sources or GitHub Release assets.
Downloads And Topics
The downloads section shows total downloads, downloads per month, and downloads per month by topic. Topic charts make it easier to spot category-level shifts, such as whether editor tooling, runtime utilities, AI packages, or integrations are gaining more attention over time.
All charts support hover snapshots for the selected timestamp. Multi-series charts also expose their labels below the chart, so related values can be read and compared together.
Visit the Trends page to explore the current data.